
Analytics at Your Service
Analythium is a startup made up of senior data scientists, mathematicians and statisticians and domain experts. We joined forces to optimize the environmental and energy industries by democratizing data science via tailored app development. Our team members have built their careers in industry, applying machine learning, artificial intelligence, and robust mathematical and statistical methods to real-world problems to improve business functionality and enable pinpointed data accuracy.
We are passionate about applying the right data algorithms to create user-friendly, insightful tools. The onset of the COVID-19 pandemic spurred us to explore how we can provide the best scientifically-based evidence to empower decision-makers in their pursuit to flatten the curve and save lives.
COVID-19 application
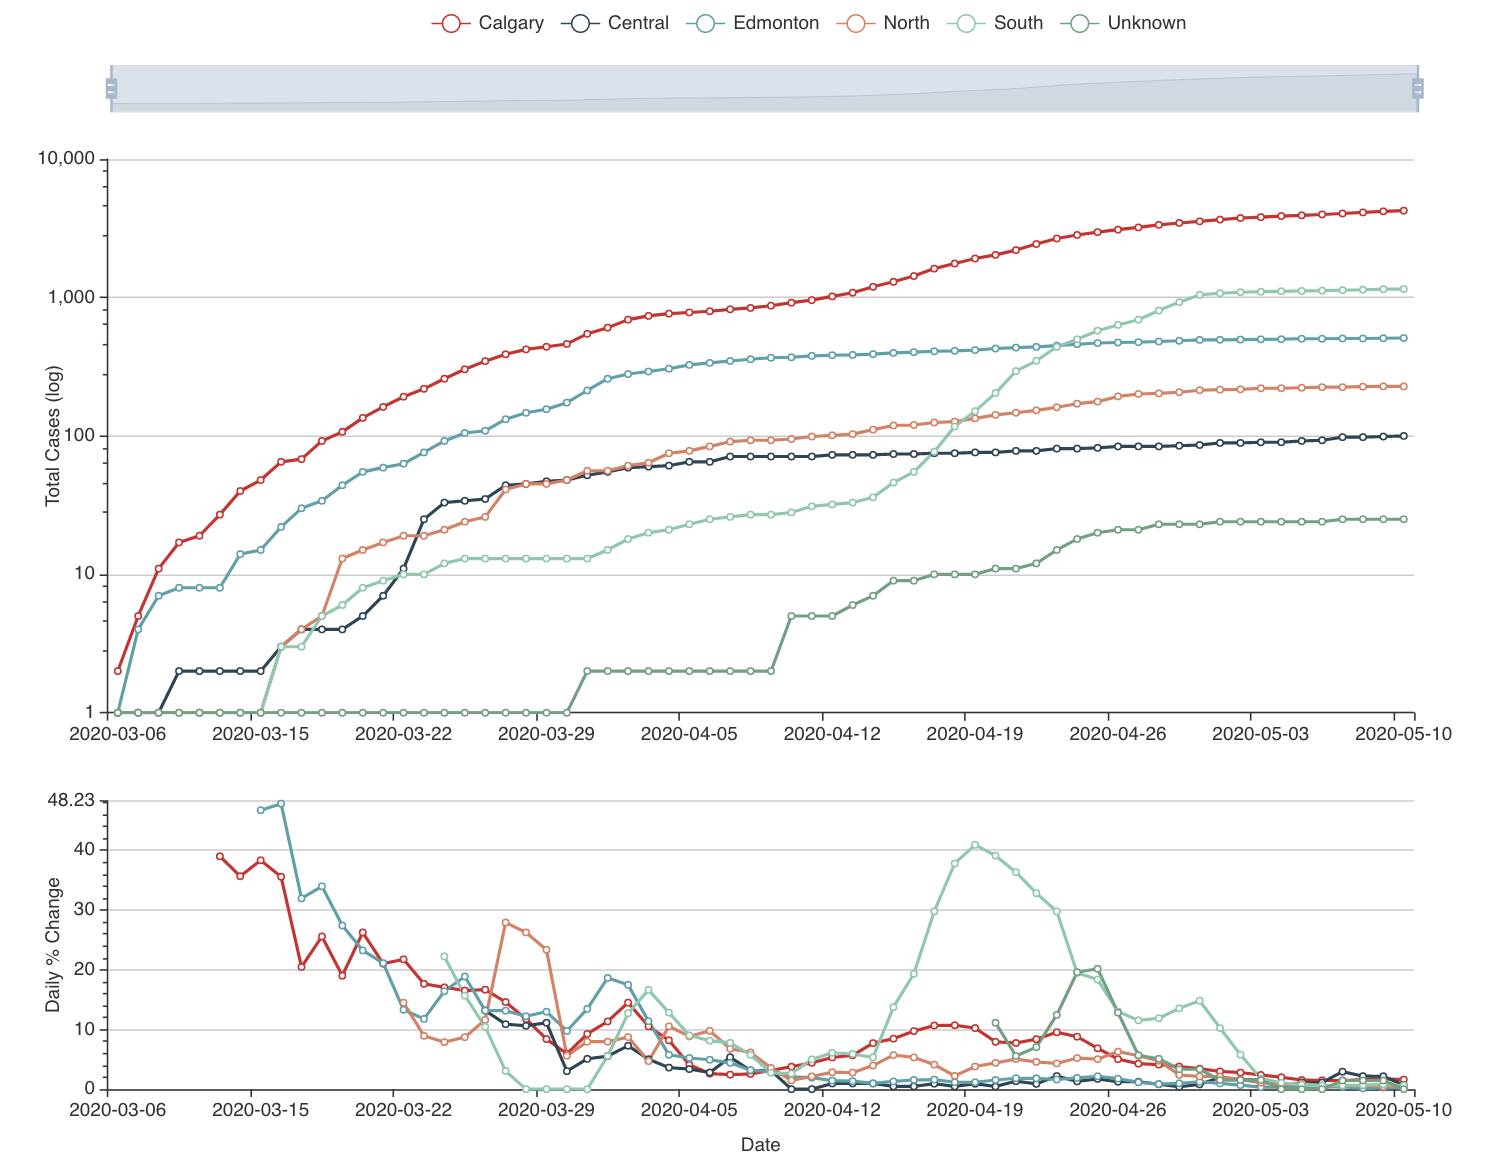
Indeed, there is no shortage of COVID-19 data or supporting apps, and counts of cases have become entrenched in our daily vernacular. Yet our app focused on our headquarter province of Alberta (thought it could be adapted to other locations), and brought together a deeper set of data sources compared with many apps currently available. Our app brings together global, national, and provincial data sources and allows further rigor by slicing the data by gender, age, and location. Using interactive geographical data visualization made it possible to easily compare differences between cities and smaller geographical areas.
In this work, we asked ourselves the question: “how does one use this data to better understand underlying mechanisms of the disease?” We outlined our ideas in a post published on the Canadian Applied and Industrial Mathematics Society (CAIMS) blog, “Are we there yet? Decision-making under extreme uncertainty in the COVID-19 pandemic”.
The final objective of the app is to assist decision-makers in:
- Assessing the effectiveness of whether policy decisions have any positive effect on change of the trend of the number of infected cases, where, and why. For instance, the Alberta intervention measures of closing “non-essential” businesses and activities had a positive effect on reducing the numbers of infections in Edmonton compared to Calgary.
- Preventing the spread. For instance, if the spatial model shows region “X” will be the next hit due to its population age, health conditions, population density, and proximity to other infected areas, then the government entity or health authority can make the decision to close the area to prevent the spread, with the supporting data to make a confident decision.
- Allocating resources where they will be most needed. The spatial predictions can give early warnings for nearby hospitals to expect more patients and be an important tool in emergency preparedness. For example, in a rural area with 0 current confirmed cases, there might already be an unknown number of infections – this number can be a function of nearby areas.
Our uniqueness
We call upon domain expertise from our network of globally-renowned academic researchers to better scope data problems in complex organizations. We leverage that expertise along with business acumen to identify business needs, and act as a translator to speak the language of data scientists and determine which problems are best solved using data science methods and algorithms.
We don’t use a black box to tell you what your business needs, instead we create dashboards and apps which bring together disparate data points (across departments, different formats and sources) to help decision-makers at all levels of the organizations get value from their data, and empower them to make data-driven choices.