

Interactive Air Quality Data Visualization
Data exploration is the first step in the development of data analytics pipelines to facilitate better decision making. Analythium specializes in building such analytics pipelines drawing upon domain expertise and using powerful statistical and machine learning techniques. In this post we explore a publicly available air quality data set from Alberta and demonstrate how visual exploration can be done on large and complex data.
In our experience, interactive data visualization is the most effective way to unlock hidden patterns in data sets. That is why one of the first things that we do when working with data is to make plot as part of exploratory data analysis. This not only helps identifying patterns but also a way of identifying problems with the data and generating new ideas.
Environmental data
Most environmental data sets are multivariate. It means that multiple variables, in this case pollutant concentrations, are measured at the same locations over multiple times. Such multivariate space-time data can pose challenges for exploratory analyses, especially if the data set is large, i.e. extensive in space and measured over many years.
The data were downloaded from the Alberta Air Data Warehouse. We downloaded sulfur dioxide (SO2) hourly measurements from all the Alberta continuous ambient air quality monitoring stations. The file contained information for 86 monitoring stations for 191,088 hourly measurements.
Data aggregation is an effective way of reducing large data into a meaningful but easier to manage set that is easier to work with and visualize. We calculated monthly averages of the hourly measurements at each monitoring station. We filled in missing values based on previous and subsequent observations in the time series. As an illustration, we took a subset of the data 2009 and 2019 for a subset of 34 monitoring stations.
Spatial interpolation
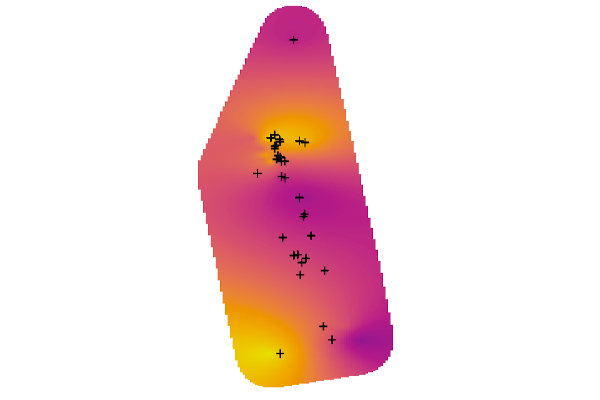
In any given month, we took the monthly average SO2 concentration values for all the stations that were operating at that time. We applied a spatial interpolation technique called kriging to predict likely concentration values between the measured locations. The next image below shows locations as crosses and the interpolated surface around those: purple is for low, yellow is for higher values.
Once we had the interpolated prediction surface for each month, we stacked these and created an animation that shows how concentrations are changing in space and over time. Because our objective was to visualize the changes in space and time and not to assess health risk, we truncated values at 2.75 parts per billion (ppb) in the animation below. SO2 values in the region rarely exceed provincial ambient air quality objectives. The truncation value is far from the applicable 11 ppb 30-day average Alberta Ambient Air Quality Objective for SO2, nevertheless, the animation nicely shows how variable the concentrations can be.
Interactive visualization
The animation is a nice touch, you might say. But how can we slice and dice the data set? To this end, we made an interactive application that allows:
- zooming in and out on a map (use gestures or the +/- icons),
- choosing different months (use the slider).
The app can also "auto play" by clicking the play button at the right end of the date slider.
We built this web application as a gateway to engaging with large and complex data in an easy and intuitive way. Of course, this approach hid many details that we are planning to explain on subsequent posts. Think of correlations between multiple measured pollutants, effects of seasonality and wind speed/direction, etc.
Don't miss our upcoming posts, consider signing up for our newsletter below to get notifications first-hand. If you have complex data that you want to leverage, we can help! Schedule a free consultation to discuss.